
Genetic analysis of DNA methylation in dyslipidemia: a case-control study
- Published
- Accepted
- Received
- Academic Editor
- Alberto Davalos
- Subject Areas
- Molecular Biology, Diabetes and Endocrinology, Hematology, Medical Genetics, Obesity
- Keywords
- Coronary artery disease, Dyslipidemia, DNA methylation, GRINA, Haplotype, CpG
- Copyright
- © 2022 Liu et al.
- Licence
- This is an open access article distributed under the terms of the Creative Commons Attribution License, which permits unrestricted use, distribution, reproduction and adaptation in any medium and for any purpose provided that it is properly attributed. For attribution, the original author(s), title, publication source (PeerJ) and either DOI or URL of the article must be cited.
- Cite this article
- 2022. Genetic analysis of DNA methylation in dyslipidemia: a case-control study. PeerJ 10:e14590 https://doi.org/10.7717/peerj.14590
Abstract
Background
Coronary heart disease has become the leading cause of death in developed countries, and dyslipidemia is closely associated with the risk of cardiovascular disease. Dyslipidemia is caused by the abnormal regulation of several genes and signaling pathways, and dyslipidemia is influenced mainly by genetic variation. AMFR, FBXW7, INSIG1, INSIG2, and MBTPS1 genes are associated with lipid metabolism. In a recent GWAS study, the GRINA gene has been reported to be associated with dyslipidemia, but its molecular mechanism has not been thoroughly investigated. The correlation between the DNA methylation of these genes and lipid metabolism has not been studied. This study aimed to examine the relationship between the DNA methylation of these genes and the risk of dyslipidemia by comparing the methylation levels of dyslipidemia and control samples.
Methods
A case-control research method was used in this study. The patient’s blood samples were collected at the Heart Center of the First Affiliated Hospital of Xinjiang Medical University. In the Xinjiang Han population, 100 cases of hyperlipidemia and 80 cases of the control group were selected. The two groups were age and gender-matched. Quantitative methylation analysis of CpG sites in the gene promoter regions of six genes was performed by Solexa high-throughput sequencing.
Results
The DNA methylation levels of 23 CpG sites in six genes were shown to be associated with hyperlipidemia, and a total of 20 DNA methylation haplotypes showed statistically significant differences between the two groups. When compared with the control group, the dyslipidemia group had significantly higher levels of methylation in the GRINA gene (2.68 vs 2.36, P = 0.04). Additionally, we also discovered a significant methylation haplotype of GRINA (P = 0.017).
Conclusion
The findings of this study reveal that the DNA methylation of GRINA increases the risk for dyslipidemia in humans.
Introduction
Coronary artery disease (CAD) is a major contributor to global mortality (GBD 2013 Mortality and Causes of Death Collaborators, 2015; Roth et al., 2015). In 2013, approximately 173,000 people died from CAD worldwide, accounting for approximately 31% of all deaths. Based on the above trends, it is estimated that about 236,000 people will die from CAD by 2030 (WHO, 2011). Related reports indicate that about 50% of the occurrence and development of CAD are attributed to elevated plasma lipids (Kisfali et al., 2010; Tada, Kawashiri & Yamagishi, 2017; Waterworth et al., 2010). Numerous studies have confirmed that changes in plasma lipid levels are closely associated with the occurrence of cardiovascular risk events (Clarke et al., 2007; Stamler et al., 2000). In a large-scale epidemiological study conducted in China between 2002 and 2014, the overall prevalence of dyslipidemia in adults increased significantly. Reducing the prevalence of dyslipidemia can significantly reduce the prevalence of cardiovascular disease in a population.
Dyslipidemia is the outcome of the interaction between the environment and genetics. Previous research has demonstrated that genetic factors influence total cholesterol, triglycerides, low-density lipoprotein cholesterol, and high-density lipoprotein cholesterol (Tada et al., 2014). However, even when the cause of the rare mutation is taken into account, known genetic variants only explain 10% to 25% of dyslipidemia. This suggests that interactions between genes and the environment cannot entirely explain the pathogenesis of dyslipidemia (Natarajan et al., 2018; Willer et al., 2013). Thus, the function of epigenetic mechanisms in regulating blood lipid levels is becoming increasingly recognized.
DNA methylation is an important form of epigenetic modification. DNA methylation refers to the covalent bonding of a methyl group to the 5th carbon position of cytosine in genomic CpG dinucleotides by DNA methyltransferase (van der Harst, de Windt & Chambers, 2017). Abnormal DNA methylation refers to the specific hypermethylation or hypomethylation of gene promoters, which decreases or increases gene expression, respectively (Baylin & Ohm, 2006). DNA methylation predominantly occurs in higher animals and affects gene expression without altering the original gene base sequence. Currently, DNA methylation is the most studied epigenetic topic in the field of lipid metabolism. Epigenome-wide association studies (EWAS) have found that methylation of several genes, including CPT1A, ABCG1, and SREBF1, are associated with lipid metabolism. Carnitine palmitoyl transferase 1A (CPT1A) is a key enzyme in the B oxidation of long-chain fatty acids in mitochondria and plays an important role in blood lipid metabolism. Braun et al. (2017) found that methylation levels at two CpG sites of CPT1A (cg00574958 and cg17058475) were inversely correlated with triglycerides and LDL cholesterol. ABCG1 is an important lipid homeostasis-regulating protein. Furthermore, earlier research has shown that the DNA methylation levels of cg06500161 and cg27243685 are positively correlated with triglycerides and negatively correlated with high-density lipoprotein cholesterol (Gomez-Alonso et al., 2021; Pfeiffer et al., 2015). SREBF1 affects cholesterol metabolism by regulating the transcription of LDLR. In a previous study, increased DNA methylation at cg11024682 and cg20544516 was found to be positively correlated with dyslipidemia (Lai et al., 2016).
However, previous research has not examined the association between the methylation of other key genes of lipid metabolism and dyslipidemia. Some genes that have been linked to dyslipidemia in population-based GWAS research have not been studied. Furthermore, earlier research has primarily focused on the relationship between DNA methylation levels at individual CpG sites of genes and dyslipidemia. There are multiple CpG sites in gene promoters, however, the relationship between DNA methylation of CpG regions and dyslipidemia has not been explored. In this study, we focused on the relationship between CpG regions in gene promoter regions and lipid metabolism. The genes (AMFR, FBXW7, INSIG1, INSIG2, and MBTPS1) were found to be associated with lipid metabolism. Glutamate receptor, ionotropic, N-methyl-D-aspartate associated protein 1 (GRINA) was found to be associated with LDL (Chu et al., 2015). However, the molecular mechanism of GRINA has not been studied. The correlation between DNA methylation of these genes and lipid metabolism has not been thoroughly investigated. This study aimed to examine the relationship between the DNA methylation of these genes and the risk of dyslipidemia by comparing methylation levels between dyslipidemia and control samples.
Materials and Methods
Study population
Before beginning this study, we developed a research strategy based on STROBE list-case control and the Declaration of Helsinki and obtained approval from the Ethical Review Committee of the First Affiliated Hospital of Xinjiang Medical University (Additional Files 1–3). From 2012 to 2015, we enrolled 100 participants as the case group and 80 participants as the control group at the First Affiliated Hospital of Xinjiang Medical University (Additional File 1). All participants’ information was collected by experienced and trained clinicians. Before data collection, all participants signed an informed consent form. The information gathered includes age, gender, history of hypertension, history of diabetes, smoking history, etc.
Dyslipidemia was defined as fasting TG level ≥1.7 mmol/L, TC level ≥5.2 mmol/L, LDL level ≥3.1 mmol/L, or HDL level <1.0 mmol/L. People who had not previously received anti-inflammatory, lipid-lowering, or other anti-heart failure treatments were considered eligible for participation in the study. The exclusion criteria were as follows: 1. Those complicated with acute heart failure, malignant arrhythmia, or other heart diseases such as heart valve disease; 2. Those combined with severe cerebrovascular, liver, kidney, and lung tissue diseases; 3. Those combined with systemic infectious diseases, malignant tumors, or thyroid disease; 4. Those combined with blood, immune, endocrine, nervous system, or severe mental illness.
DNA isolation and epigenotyping
Fasting venous blood was drawn from all participants and placed in an EDTA (ethylene diamine tetraacetic acid) anticoagulant tube. DNA was extracted from peripheral blood using commercial kits (TIANGEN Biotech, Beijing, China) and diluted with 75% ethanol before sequencing and analyzing the DNA methylation.
DNA methylation was evaluated by BiSulfite Amplicon Sequencing (BSAS). The purpose of using BSAS to modify DNA is to completely convert the unmethylated cytosine in the DNA sequence into uracil, while the methylcytosine remains unchanged. The CpG islands distributed in promoters and first exon areas of AMFR, FBXW7, INSIG1, INSIG2, MBTPS1, and GRINA genes were sequenced using an Illumina MiSeq Benchtop Sequencer (San Diego, CA, USA) for methylation genotyping and analysis (Because the effect of DNA methylation on gene transcription mostly occurs in the promoter region and the first exon region). Finally, three regions from CpG islands of AMFR, three from FBXW7, three from INSIG1, one from INSIG2, two from MBTPS1, and two from GRINA were selected and sequenced (Fig. 1). Bisulfite converse the base of 1 μg genomic DNA using EZ DNA Methylation- GOLD Kit (Zymo Research, Irvine, CA, USA) before sequencing. The CpG areas examined were defined as the distance (in bp) between CpG sites and the transcription start site (TSS). The CpG site methylation level was defined as the methylated cytosine/ whole cytosine ratio. The gene methylation level was defined as the average methylation level of all detected CpG sites. The criteria for CpG site selection and the specific process of DNA methylation analysis are based on our previous research methods, which are documented in Additional File 1 (Li et al., 2020).
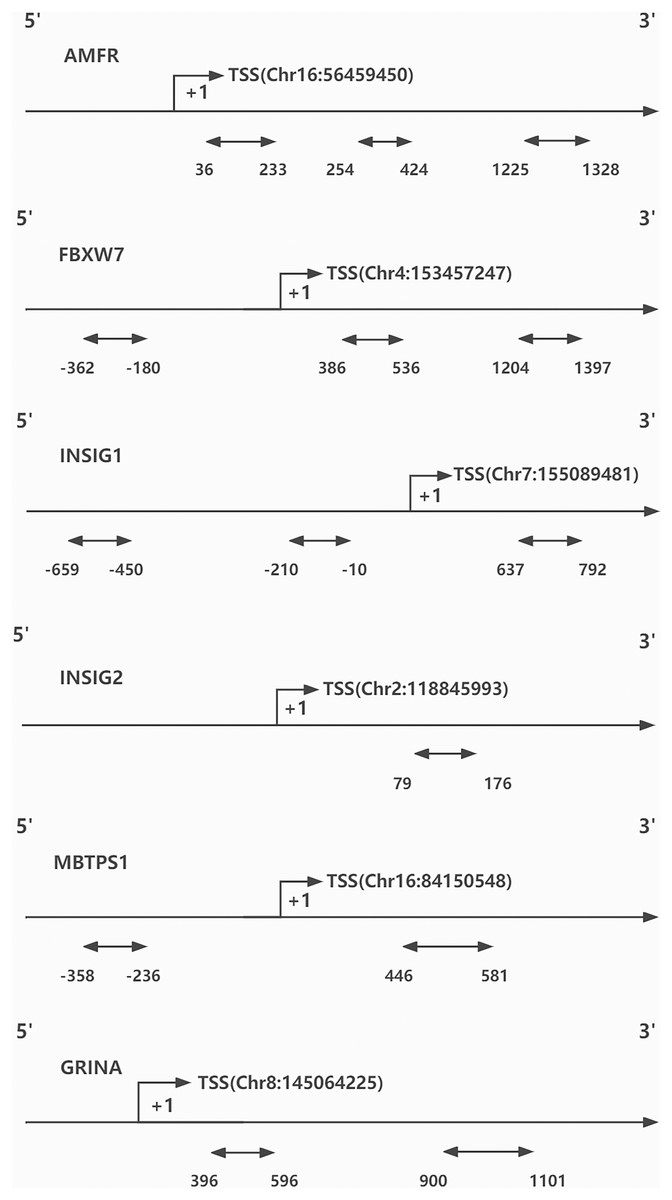
Figure 1: CpG sites sequenced around the promoters of genes.
TSS, transcription start site.
Statistical analysis
All data analyses were performed using SPSS 22.0, and the Kolmogorov-Smirnov method was used to test the normality of the measurement data. Measurement data conforming to the normal distribution were expressed as mean ± standard deviation. The t-test was used to compare the means of two independent samples. The overall methylation level of each group of DNA samples was expressed as median (interquartile range). The Mann-Whitney U test was used to compare groups with non-normally distributed measurement data. Counting data were expressed as the number of cases (percentage). We applied the Chi-square test or Fisher’s exact test to examine count data. P < 0.05 indicates a statistically significant difference. Logistic regression analyses (OR and 95% CI) were used to determine independent risk factors or protective factors of the disease.
Result
A total of 180 participants were included for data analysis. Table 1 shows the demographic characteristics of the study participants. The average age of the 180 participants was 59.89 ± 10.97 years old, with 60 (33.3%) of them being female. Because the degree of DNA methylation was significantly correlated with gender and age, there were no significant gender and age differences between the two groups, indicating that the research protocol was feasible. There were 100 (55.5%) participants with HTN and 44 (24.4%) with DM. The dyslipidemia group had a higher prevalence of hypertension and diabetes than the control group. The dyslipidemia group had higher levels of TC, TG, HDL, LDL, and glucose than the control group (Table 1).
| Characteristics | All (n = 180) | Without dyslipidemia (n = 80) | With dyslipidemia (n = 100) | P value |
|---|---|---|---|---|
| Age, years | 59.89 ± 10.97 | 58.56 ± 11.60 | 60.45 ± 10.38 | 0.148 |
| Female, n (%) | 60 (33.3) | 28 (35) | 32 (32) | 0.671 |
| HTN, n (%) | 100 (55.5) | 33 (41.25) | 67 (67) | 0.001 |
| Diabetes, n (%) | 44 (24.4) | 10 (12.5) | 34 (34) | 0.001 |
| TC, mmol/l | 4.38 ± 1.20 | 3.61 ± 0.66 | 4.99 ± 1.19 | 0.001 |
| TG, mmol/l | 1.79 ± 1.05 | 1.11 ± 0.33 | 2.34 ± 1.10 | 0.001 |
| HDL, mmol/l | 1.20 ± 0.32 | 1.35 ± 0.30 | 1.09 ± 0.28 | 0.001 |
| LDL, mmol/l | 2.91 ± 1.02 | 2.17 ± 0.64 | 3.52 ± 0.85 | 0.001 |
| Glucose, mmol/l | 6.00 ± 2.33 | 5.14 ± 1.31 | 6.69 ± 2.72 | 0.001 |
| GSP, mmol/L | 2.30 ± 0.44 | 2.22 ± 0.38 | 2.36 ± 0.47 | 0.025 |
| Creatinine, mmol/L | 71.96 ± 20.77 | 71.03 ± 17.70 | 72.70 ± 22.98 | 0.593 |
| Smoking, n (%) | 56 (31.1) | 22 (27.5) | 34 (34) | 0.349 |
Notes:
The Kolmogorov-Smirnov method was used to test the normality of the measurement data. The measurement data conforming to the normal distribution are expressed as the mean ± standard deviation. The comparison of the means between the two groups uses two independent samples. t test. The non-normally distributed measurement data used the median (interquartile range), and the Mann Whitney U test was used for comparison between groups. For counting data, it is expressed as the number of cases (percentage). Apply Chi-square test or Fishers exact test. if P < 0.001 will described as P = 0.001.
HTN, hypertension; TC, Total cholesterol; TG, Triglyceride; HDL, High-density lipoprotein; LDL, Low-density lipoprotein; GSP, Glycated serum protein.
A total of 259 CpG sites (62 in AMFR, 51 in FBXW7, 70 in INSIG1, 10 in INSIG2, 24 in MBTPS1, and 42 in GRINA) were measured in target 11 regions (the specific CPG distribution information is listed in the Additional File 4). After analyzing the CpG sites of different regions, a total of 24 CpG sites were discovered to be related to dyslipidemia. The CpG sites with differences in DNA methylation expression levels in dyslipidemia and control groups are listed. Dyslipidemia is linked to CpG sites 34 and 69 of the GRINA gene (Table 2).
| Gene | Genome position | Distance 2TSS | Region position | Methylation level (median %, minimum—maximum) | P value | |
|---|---|---|---|---|---|---|
| Without dyslipidemia (n = 80) | With dyslipidemia (n = 100) | |||||
| GRINA_1 | 145,064,632 | 407 | 34 | 0.50 (0–5.29) | 0.92 (0–4.82) | 0.012 |
| 145,064,667 | 442 | 69 | 0.85 (0–3.27) | 0.60 (0–3.56) | 0.023 | |
| GRINA_2 | 145,065,320 | 1,095 | 37 | 0.71 (0–25) | 3.77 (0–26.92) | 0.028 |
| MBTPS1 | 84,150,882 | −334 | 53 | 3.59 (1.36–7.18) | 3.80 (2.01–6.13) | 0.038 |
| 84,150,868 | −320 | 67 | 3.41 (2.11–5.64) | 3.62 (155–6.71) | 0.016 | |
| 84,150,784 | −236 | 151 | 0.43 (0–1.16) | 0.49 (0–1.05) | 0.047 | |
| INSIG1_2 | 155,089,454 | −27 | 41 | 0 (0–5) | 0 (0–4.55) | 0.042 |
| 155,089,391 | −90 | 104 | 1.80 (0–7.45) | 1.32 (0–6.67) | 0.028 | |
| 155,089,369 | −112 | 126 | 1.79 (0–7.79) | 2.4 (0–10.34) | 0.044 | |
| INSIG1_3 | 155,090,156 | 675 | 66 | 0.57 (0–1.65) | 0.67 (0–2.35) | 0.024 |
| INSIG2 | 118,846,072 | 79 | 28 | 0 (0–11.11) | 0 (0–13.33) | 0.039 |
| FBXW7_1 | 153,456,802 | 445 | 85 | 5.13 (0–10.53) | 4.70 (0–8.81) | 0.048 |
| 153,456,754 | 493 | 133 | 1.07 (0–5.26) | 1.42 (0–4.50) | 0.050 | |
| FBXW7_2 | 153,457,430 | −183 | 30 | 0.43 (0–2.12) | 0.52 (0–1.63) | 0.025 |
| 153,457,454 | −207 | 54 | 0.75 (0–6.67) | 0.97 (0.11–2.30) | 0.025 | |
| 153,457,492 | −245 | 92 | 0.38 (0–7.69) | 0.45 (0.08–1.37) | 0.028 | |
| 153,457,529 | −282 | 129 | 1.77 (0–5.56) | 1.87 (0.80–3.20) | 0.021 | |
| 153,457,534 | −287 | 134 | 1.42 (0–3.23) | 1.56 (0–2.79) | 0.017 | |
| AMFR_1_ | 56,459,028 | 422 | 39 | 0.49 (0–2.17) | 0.73 (0–1.76) | 0.003 |
| 56,459,044 | 406 | 55 | 1.49 (0.27–4.18) | 1.26 (0–3.27) | 0.027 | |
| 56,459,196 | 254 | 207 | 1.55 (0.16–4) | 1.86 (0.53–4.57) | 0.007 | |
| AMFR_2 | 56,459,330 | 120 | 140 | 0 (0–3.85) | 0 (0–4.26) | 0.019 |
| 56,459,414 | 36 | 224 | 0 (0–4.35) | 0 (0–6.67) | 0.008 | |
| AMFR_3 | 56,458,225 | 1,225 | 94 | 2.99 (0–20) | 2.34 (0–7.33) | 0.013 |
Notes:
The non-normally distributed measurement data used the median (interquartile range), and the Mann Whitney U test was used for comparison between groups.
Genome Position: Location of CpG site on the genome Distance. Distance 2TSS: The distance of the CpG site relative to the transcription start site on the reference genome. Region Position: The position of the CpG site on the CpG region. Methylation Level: The methylated cytosine/whole cytosine ratio was defined as the CpG site methylation level.
In our comprehensive analysis of CpG sites in distinct gene regions, we defined the average methylation level of CpG sites as the methylation level of genes. The average DNA methylation levels of AMFR, FBXW7, INSIG1, INSIG2, and MBTPS1 genes were not significantly associated with dyslipidemia. DNA methylation of GRINA (Table 3), on the other hand, was associated with dyslipidemia. When compared with the control group, the dyslipidemia group had higher DNA methylation levels of GRINA (2.71 vs 2.44, P = 0.04).
| Gene | Gene methylation level (%) | Methyl different (%) | P value | |
|---|---|---|---|---|
| Without dyslipidemia (n = 80) | With dyslipidemia (n = 100) | |||
| AMFR | 1.30 (0.36–2.07) | 1.27 (0.90–2.05) | −0.03 | 0.77 |
| FBXW7 | 1.65 (0.46–2.05) | 1.63 (0.91–2.13) | −0.02 | 0.61 |
| INSIG1 | 1.27 (0.77–1.64) | 1.28 (0.75–1.76) | 0.01 | 0.80 |
| INSIG2 | 2.44 (0–11.6) | 2.47 (0–6.12) | 0.03 | 0.80 |
| MBTPS1 | 2.07 (1.67–17.85) | 2.1 (1.67–14.20) | 0.03 | 0.66 |
| GRINA | 2.44 (0.424–4.43) | 2.71 (0.79–5.50) | 0.32 | 0.04 |
Notes:
The non-normally distributed measurement data used the median (interquartile range), and the Mann Whitney U test was used for comparison between groups.
Gene methylation level: The average methylation level of all detected CpG sites was defined as the gene methylation level.
The analysis of DNA methylation haplotypes of distinct genes revealed specific methylation haplotypes (Table 4). The DNA methylation haplotype with significant abundance of GRINA gene was ttttttttttttcttttttttttt (P = 0.017).
| Gene | Haplotype | P value |
|---|---|---|
| AMFR_1_ | ttttttttttttttttctttttttt | 0.003 |
| tcttttttttttttttttttttttt | 0.005 | |
| FBXW7 | ttttttttttttttttttttctt | 0.019 |
| tttttcttttttttttttttttt | 0.006 | |
| INSIG1 | ttctttttttttttttt | 0.010 |
| tttttttttttttttttttcttttttttttttttttt | 0.021 | |
| tttttttttttttttttttttttcttttttttttttt | 0.046 | |
| ttttcttttttttttt | 0.013 | |
| tctttttttttttttt | 0.043 | |
| INSIG2 | ttttttttct | 0.012 |
| tttttctttt | 0.012 | |
| ttttcttttt | 0.039 | |
| MBTPS2_ | ttttttctttt | 0.019 |
| tttttttttct | 0.014 | |
| tttcttttttt | 0.007 | |
| tcttttttttt | 0.044 | |
| ttctttttttt | 0.019 | |
| tcccctccctc | 0.013 | |
| tcccccccttt | 0.013 | |
| GRINA | ttttttttttttcttttttttttt | 0.017 |
Notes:
The non-normally distributed measurement data used the median (interquartile range), and the Mann Whitney U test was used for comparison between groups.
Haplotype: Assuming that the amplified sub sequence is “AXTXAXT”, X can be C (methylated) or T (unmethylated). If the sequencing result is “ATTCATT”, the amplified methylation haplotype is “tct”.
The methylation levels of GRINA are a risk factor for dyslipidemia (P = 0.019, OR = 1.548 95% CI [1.073–2.233]) (Table 5). Participants with higher GRINA methylation have a 54% increased risk of dyslipidemia. Hypertension (P = 0.024, OR = 2.184 95% CI [1.109–4.302]) and hyperglycemia (P = 0.003, OR = 1.408 95% CI [1.122–1.766]) are risk factors for dyslipidemia, which is consistent with previous research. Participants with higher blood glucose or hypertension have a 40–118% increased risk of developing dyslipidemia.
| Characteristics | Univariate | Multivariate | ||
|---|---|---|---|---|
| P value | OR | P value | OR | |
| GRINA | 0.028 | 1.459 [1.041–2.044] | 0.019 | 1.548 [1.073–2.233] |
| Sex | 0.638 | 0.861 [0.462–1.604] | ||
| Age | 0.148 | 1.020 [0.993–1.048] | ||
| Smoking | 0.194 | 0.656 [0.347–1.240] | ||
| Hypertension | 0.001 | 2.807 [1.530–5.150] | 0.024 | 2.184 [1.109–4.302] |
| Diabetes | 0.001 | 3.606 [1.651–7.876] | 0.241 | 1.701 [0.700–4.132] |
| Creatinine | 0.591 | 1.004 [0.990–1.018] | ||
| Glucose | 0.001 | 1.549 [1.255–1.910] | 0.003 | 1.408 [1.122–1.766] |
| Gsp | 0.031 | 2.157 [1.071–4.344] | 0.211 | 1.679 [0.745–3.782] |
Note:
P < 0.05 indicates statistical difference. Logistic regression analyses (OR and 95% CI) is used to analyze independent risk factors or protective factors of the disease.
Discussion
In recent years, various genome-wide association studies (GWAS) have discovered common mutants that affect blood lipid metabolism (Do et al., 2015; Jørgensen et al., 2014; Crosby et al., 2014). Over the last decade, researchers have discovered the specific molecular mechanisms of several plasma lipid-related genes such as LDLR, APOB, and PCSK9. Recent research has also discovered a link between the LIMA-1 gene and lipid metabolism (Chu et al., 2015; Zhang et al., 2018). In addition to genetic inheritance, epigenetic changes are also related to lipid metabolism (Fazio & Linton, 2012). Previous research has discovered that HMG CoA Reductase (HMGCR) catalyzes the conversion of HMG-CoA to mevalonate, which is the rate-limiting step in cholesterol biosynthesis. Sterols promote HMGCR degradation via the ubiquitin-proteasome pathway, thus slowing down cholesterol biosynthesis. Autocrine Motility Factor Receptor (AMFR) is a ubiquitin ligase anchored to the ER membrane and can ubiquitinate HMGCR. AMFR interacts with another endoplasmic reticulum membrane protein insulin-induced gene (INSIG)-1 or INSIG-2 via its transmembrane domain to form a complex. Low cholesterol levels prevent HMGCR from binding to the INSIG-AMFR complex. HMGCR interacts with the INSIG-AMFR complex when cholesterol levels increase, resulting in ubiquitination and degradation of HMGCR (Song, Javitt & DeBose-Boyd, 2005; Song, Sever & DeBose-Boyd, 2005). According to previous research, membrane-bound transcription factor protease site 1 (MBTPS1) gene expression protein is a member of the PCSK9 protease family (PCSK1, PCSK2, FURIN, PCSK4-PCSK7, MBTPS1, and PCSK9), which cleaves the target protein to activate it (Taylor, Van De Ven & Creemers, 2003). Previous research demonstrates that PCSK9 is an important protein that regulates lipid metabolism. PCSK enzymes play an important role in the progression of atherosclerosis by modulating the activity of the pre-atherosclerosis factor (Stawowy & Fleck, 2005). Glutamate receptor, ionotropic, N-methyl-D-aspartate associated protein 1 (GRINA) was found to be associated with LDL (Wu et al., 2018). However, the molecular mechanism of GRINA has not been thoroughly investigated. However previous research has indicated that only about 40–50% of changes in LDL-C levels are determined by genetic factors (Nadir & Struthers, 2011; Palacios et al., 2012). It is unknown whether the DNA methylation levels of these key lipid metabolism genes are associated with dyslipidemia.
In this study, three CpG sites in MBTPS1, two CpG sites in INSIG1, one CpG site in INSIG2, seven CpG sites in FBXW7, and six CpG sites in AMFR were found to be associated with dyslipidemia. In contrast to previous research, we not only examined the relationship between DNA methylation at CpG sites and dyslipidemia but also determined the relationship between overall DNA methylation at CpG regions and dyslipidemia. This study found a significant correlation between DNA methylation in the CpG region of GRINA and dyslipidemia. The study also demonstrated that DNA methylation of three CpG sites in the GRINA gene was associated with dyslipidemia. Logistic regression analysis revealed that DNA methylation of GRINA may increase the risk of dyslipidemia. These findings support the notion that GRINA DNA methylation may increase the risk of dyslipidemia. In our previous research, we discovered that DNA methylation of the TBL2 gene is associated with hyper-low-density lipoprotein cholesterolemia. However, Hyper-LDL is only one type of dyslipidemia. The relationship between DNA methylation and dyslipidemia has not been exhaustively studied. In this study, the relationship between the DNA methylation level of the TBL2 gene and abnormal blood lipids was examined. The DNA methylation level of the TBL2 gene was lower in the dyslipidemia group than in the control group consistent with previous findings. At the same time, the previously discovered distinct CpG sites were also detected. Further verification of the reliability of the results is required.
DNA methylation is a pre-transcriptional modification that involves the precise addition of methyl groups to a nucleotide. DNA methylation regulates gene expression and preserves genomic integrity by interacting with modified nucleosome proteins (Jin & Liu, 2018). CpG islands around transcriptional initiation sites in the genome are allocated differently at certain stages. Typically, DNA methylation in conjunction with CG methylation inhibits gene expression (Weber et al., 2005; Song et al., 2005; Grunau, Hindermann & Rosenthal, 2000). There are two ways in which promoter methylation might inhibit gene transcription. First, physically detaching the transcription elements and gene promoter complexes. Second, histone or chromatin modifiers bind to the methyl-CpG-binding domain, thereby activating repressive machinery and causing chromatin compaction (Clouaire et al., 2010). Methylated CpG islands are biological indicators of gene suppression because the function as docking sites for methyl-binding proteins. They can primarily inhibit transcription components to gene promoters, recruit transcription inhibitors, and impede activation protein binding (Luo, Hajkova & Ecker, 2018). In our previous research, we found that the DNA methylation level of the TBL2 gene is associated with hyper-low-density lipoprotein cholesterolemia (Li et al., 2020).
GRINA is a member of the TMBIM gene family, which codes for six proteins possessing a transmembrane BAX inhibitor motif (TMBIM). These genes encode calcium channels present in the Golgi, endoplasmic reticulum (ER), and mitochondria, which regulate calcium homeostasis (Lisak et al., 2015; Rojas-Rivera et al., 2012; Rice et al., 2019). According to a recent study, GRINA/TMBIM3 modulates voltage-gated Ca V 2.2 Ca2+ channels in a G-protein-like manner (Mallmann et al., 2019). TMBIMs regulate cell death, including during ER stress by regulating calcium flow, with the majority of the proteins being anti-apoptotic (Rice et al., 2019; Liu, 2017). Recent clinical research has demonstrated that the transmembrane protein GRINA modulates aerobic glycolysis and promotes tumor progression in gastric cancer (Xu et al., 2018). GRINA was also found to be associated with elevated levels of antigliadin antibodies (AGA IgG) in subgroups of schizophrenics (Cihakova et al., 2019). Rice et al. (2019) also discovered that GRINA is a novel methylation quantitative trait loci associated with osteoarthritis. Previous research has associated the inhibition of calcium channels with an increase in membrane cholesterol in neuroblastoma-glioma hybrid cells. We hypothesized that GRINA regulates membrane cholesterol by regulating calcium channels.
In gene expression studies, the expression levels of the Nuclear Receptor Subfamily 1 Group H Member 2 gene (NR1H2) and GRINA expression levels are comparable across conditions. The Gene Expression Omnibus (GEO) database demonstrates the co-expression relationship between the NR1H2 and GRINA genes (Bahr et al., 2013; Dobbin et al., 2005; Rieger et al., 2004; Wang, Ramrattan & Cheung, 2015). According to the reactome pathways data, NR1H2 is associated with VLDLR. NR1H2 is a protein-coding gene. Previous research has demonstrated that NR1H2 is associated with biliary diseases. NR1H2 is associated with the lipid metabolism pathway. NR1H2 activates ABCA1 (ATP Binding Cassette Subfamily A Member 1) gene transcription by binding to the ABCA1 gene promoter, which is mediated by PPARγ (Mogilenko et al., 2010). ABCA1 also plays a significant role in cholesterol efflux on the plasma membrane. Under conditions of high cellular cholesterol content, NR1H2 dissociates from surface-resident ABCA1 (csABCA1), rendering csABCA1 susceptible to ubiquitination (Fu et al., 2013; Mizuno, Hayashi & Kusuhara, 2015). Previous research has shown that ABCA1 is closely associated with lipid metabolism, and ABCA1 in the liver is involved in the transformation of phospholipid to apolipoproteins and the formation of high-density lipoprotein cholesterol (Quazi & Molday, 2013). Overall, the up-regulation of GRINA gene DNA methylation influences the expression of the NRIH2 gene, which in turn affects the expression of ABCA1 on the plasma membrane and cholesterol efflux.
In contrast, prior research demonstrated that NR1H2 is recruited in the promoter region of the Sterol Regulatory Element Binding Transcription Factor (SREBF) gene to influence the regulation of SREBF1 (Flaveny et al., 2015). SREBFs are transcription factors that regulate the transcription of genes involved in lipid and cholesterol metabolism. SREBFs regulate cellular cholesterol homeostasis. SREBF cleavage activation protein (SCAP) and INSIG form a composite with SREBF to aid in its transport to the Golgi apparatus in sterol-depleted cells. Sterol-depleted cells have two special proteases, which can convert related enzymes into those that stimulate the amino-terminal transcription operating region of SREBF. The activated SREBF complex can then enter the nucleus and bind to the promoter of the target gene (Rawson, 2003; Walker et al., 2011). In addition, previous research has demonstrated a correlation between GRINA and SREBF. Overall, the increased DNA methylation of GRINA may affect the SREBF pathway by altering the expression of the NR1H2 gene, and consequently, blood lipid metabolism.
NR1H2 can induce the expression of the IDOL gene, and IDOL can reduce the level of LDLR by catalyzing its ubiquitination. The reduction in LDLR causes alterations in serum cholesterol levels (Zelcer et al., 2009). Therefore, we hypothesized that the increase in GRINA methylation affects the level of NR1H2, which, in turn, affects the level of LDLR and, ultimately, the change in serum cholesterol.
Study strengths and limitations
There are several advantages to this study. One of the most significant advantages is that it is the first to discover that GRINA methylation is associated with dyslipidemia. This study also discovered that several GRINA haplotypes are associated with dyslipidemia. Furthermore, this study was the first to discover that several CpG sites in genes involved in lipid metabolism (AMFR, FBXW7, INSIG1/2, MBTPS2) are associated with dyslipidemia. In the future, these findings could be used to predict diseases using gene methylation. Third, this is a random case-control study, with a human subject and therapeutic application value. This study also has limitations. First, this study is a correlation study. Further functional research is required to interpret the mechanisms linking GRINA methylation to dyslipidemia. Second, this is a single-center study, and all participants were Han Chinese, which may limit the generalizability of the findings.
Conclusions
The results of this study suggest that DNA methylation of GRINA increases the risk for dyslipidemia in humans. The DNA methylation levels of 23 CpG sites in six genes were shown to be associated with dyslipidemia, and a total of 20 DNA methylation haplotypes showed statistically significant differences between the two groups.