
Salivary miRNAs as non-invasive biomarkers of hepatocellular carcinoma: a pilot study
- Published
- Accepted
- Received
- Academic Editor
- Alberto Davalos
- Subject Areas
- Bioinformatics, Molecular Biology, Gastroenterology and Hepatology, Oncology, Data Mining and Machine Learning
- Keywords
- Transcriptomics, Biomarker, Hepatocellular carcinoma, Liver cancer, Saliva, Non-invasive, Cirrhosis, Machine-learning
- Copyright
- © 2022 Mariam et al.
- Licence
- This is an open access article distributed under the terms of the Creative Commons Attribution License, which permits using, remixing, and building upon the work non-commercially, as long as it is properly attributed. For attribution, the original author(s), title, publication source (PeerJ) and either DOI or URL of the article must be cited.
- Cite this article
- 2022. Salivary miRNAs as non-invasive biomarkers of hepatocellular carcinoma: a pilot study. PeerJ 10:e12715 https://doi.org/10.7717/peerj.12715
Abstract
Background
Improved detection of hepatocellular carcinoma (HCC) is needed, as current detection methods, such as alpha fetoprotein (AFP) and ultrasound, suffer from poor sensitivity. MicroRNAs (miRNAs) are small, non-coding RNAs that regulate many cellular functions and impact cancer development and progression. Notably, miRNAs are detectable in saliva and have shown potential as non-invasive biomarkers for a number of cancers including breast, oral, and lung cancers. Here, we present, to our knowledge, the first report of salivary miRNAs in HCC and compare these findings to patients with cirrhosis, a high-risk cohort for HCC.
Methods
We performed small RNA sequencing in 20 patients with HCC and 19 with cirrhosis. Eleven patients with HCC had chronic liver disease, and analyses were performed with these samples combined and stratified by the presence of chronic liver disease. P values were adjusted for multiple comparisons using a false discovery rate (FDR) approach and miRNA with FDR P < 0.05 were considered statistically significant. Differential expression of salivary miRNAs was compared to a previously published report of miRNAs in liver tissue of patients with HCC vs cirrhosis. Support vector machines and leave-one-out cross-validation were performed to determine if salivary miRNAs have predictive potential for detecting HCC.
Results
A total of 4,565 precursor and mature miRNAs were detected in saliva and 365 were significantly different between those with HCC compared to cirrhosis (FDR P < 0.05). Interestingly, 283 of these miRNAs were significantly downregulated in patients with HCC. Machine-learning identified a combination of 10 miRNAs and covariates that accurately classified patients with HCC (AUC = 0.87). In addition, we identified three miRNAs that were differentially expressed in HCC saliva samples and in a previously published study of miRNAs in HCC tissue compared to cirrhotic liver tissue.
Conclusions
This study demonstrates, for the first time, that miRNAs relevant to HCC are detectable in saliva, that salivary miRNA signatures show potential to be highly sensitive and specific non-invasive biomarkers of HCC, and that additional studies utilizing larger cohorts are needed.
Introduction
Liver cancer is the most rapidly increasing cancer among men and women in the United States and is estimated to have resulted in 31,780 deaths in 2019 (American Cancer Society, 2019). Hepatocellular carcinoma (HCC) accounts for 80% of all primary liver cancers, and the global incidence of HCC is expected to increase to 78 million by 2030 (Petrick et al., 2016) due to increasing nonalcoholic steatohepatitis (NASH), hepatitis C, and excessive alcohol consumption. Early detection of HCC has shown to improve reception of curative therapy and overall survival (Singal, Pillai & Tiro, 2014). However, current HCC serum biomarkers, such as alpha fetoprotein (AFP) lack prognostic and diagnostic value (39–65% sensitivity) (Daniele et al., 2004). Although resection is the treatment of choice for many patients, as many as 54% will recur within 2 years, and ~70% within 5 years (Forner et al., 2006; Tabrizian et al., 2015). As early detection is associated with improved prognosis and overall survival, reliable biomarkers are needed to detect tumor in early stages of development.
MicroRNAs (miRNAs) are small, non-coding RNA molecules that regulate gene expression by translational inhibition or mRNA degradation. Although the majority of miRNA regulation occurs intracellularly, in some cases select miRNAs are found in the circulation and have been associated with a plethora of human diseases. Several studies have shown miRNA expression is associated with cancer (Eslam, Valenti & Romeo, 2018), NASH/NAFLD and alcoholic hepatitis (Blaya et al., 2016; Eslam, Valenti & Romeo, 2018), and patient survival (Pineau et al., 2010; Dongiovanni et al., 2018). In addition, differentially expressed miRNA in blood have been detected in HCC (Murakami et al., 2012; Qi et al., 2013). However, it is not known if detectable alterations in salivary miRNAs are present in patients with HCC. Previously, miRNA abundance in saliva has been associated with oral, head and neck, lung, and breast cancers (Zhang et al., 2010, 2012; Elashoff et al., 2012; Salazar, Calvopiña & Punyadeera, 2014; Salazar et al., 2014; Wan et al., 2017). Saliva is an attractive biospecimen for biomarkers because (1) it is non-invasive, (2) less expensive than more invasive biospecimens, (3) can be collected without requiring a patient to go to the doctor’s office, and (4) saliva collection tubes can now stabilize samples at room temperature for months (Nunes et al., 2012; Lim et al., 2016), allowing for the possibility that patients may be able to submit their sample through the mail.
Here, we conducted a pilot-study to evaluate if miRNAs are differentially expressed in the saliva of patients with HCC compared to the saliva of patients with cirrhosis. Furthermore, we evaluate how these miRNAs compare to previously reported tissue- and blood-based miRNAs in HCC, and determine the potential for saliva miRNAs to serve as a non-invasive, diagnostic biomarker for HCC.
Materials and Methods
Patient recruitment and sample collection
Saliva samples were collected from 20 individuals with HCC and 19 from individuals with cirrhosis seen at the Cleveland Clinic (Cleveland, OH). Participants were adult patients (>18 years of age) who underwent liver transplantation for HCC, surgical resection for liver tumors or liver biopsy. Some patients with HCC had previously received treatment but all had active HCC at the time of collection. Prior treatments and clinical staging for patients with HCC can be found in Table S1. A description of the cohort is provided in Table 1, including the frequencies of chronic liver disease (CLD) between the two groups. Twelve out of the twenty patients with HCC had CLD, and analyses were performed with these samples combined and stratified by liver disease, as described below. Initial disease diagnoses were made from a combination of clinical presentation, imaging and laboratory techniques. Subsequently, these diagnoses underwent a secondary confirmatory pathological diagnosis. All participants provided written informed consent and the study was approved by the Cleveland Clinic IRB (IRB #10-347).
| Characteristic | Cirrhosis without HCC | HCC | |||
|---|---|---|---|---|---|
| Total (N) | 19 | 20 | |||
| Mean age (min-max) | 57.2 (33–80) | 67.9 (53–89) | |||
| Sex | |||||
| Male (%) | 9 (47%) | 14 (70%) | |||
| Female (%) | 10 (53%) | 6 (30%) | |||
| Race | |||||
| Caucasian (%) | 18 (95%) | 10 (50%) | |||
| Black (%) | 0 (0%) | 0 (0%) | |||
| Hispanic (%) | 1 (5%) | 1 (5%) | |||
| Unspecified (%) | 18 (95%) | 9 (45%) | |||
| Mean BMI (min-max) | 33.12 (21.07–57.96) | 29.44 (19.53–41.8) | |||
| Chronic liver disease | 19 (100%) | 12 (60%) | |||
| Fibrosis (%) | 0 (0%) | 2 (10%) | |||
| Cirrhosis (%) | 19 (100%) | 10 (50%) | |||
| NASH (%) | 7 (37%) | 5 (25%) | |||
| EtOHa (%) | 7 (37%) | 7 (35%) | |||
| HCVb (%) | 0 (0%) | 7 (35%) | |||
| HBVc (%) | 0 (0%) | 2 (10%) | |||
| Primary biliary cholangitis (%) | 2 (11%) | 0 (0%) | |||
| Primary sclerosing cholangitis (%) | 1 (5%) | 0 (0%) | |||
| Autoimmune hepatitis (%) | 1 (5) | 0 (0%) | |||
| Other (%) | 0 (0%) | 0 (0%) | |||
| Child-pugh score | |||||
| 5–6 | 8 | 8 | |||
| 7–9 | 10 | 1 | |||
| 10–15 | 1 | 1 | |||
| Diabetes mellitus (%) | 9 (47%) | 10 (50%) | |||
| Hypertension (%) | 6 (32%) | 16 (80%) | |||
| Coronary artery disease (%) | 2 (11%) | 7 (35%) | |||
| Hyperlipidemia (%) | 5 (26%) | 14 (70%) | |||
| Psychiatric disorder (%) | 3 (16%) | 6 (30%) | |||
| Other cancer (%) | 1 (5%) | 3 (15%) | |||
| COPDd/Asthma/OSAe | 3 (16%) | 6 (30%) | |||
| Thyroid | 5 (26%) | 0 (0%) | |||
| Other PHf | 0 (0%) | 0 (0%) | |||
| Ascites | 8 (42%) | 1 (5%) | |||
| Encephalopathy | 8 (42%) | 0 (0%) | |||
| Mean hemoglobin (std.err) | 10.68 (0.7) | 12.80 (0.5) | |||
| Mean platelets (std.err) | 116 (16.2) | 210 (19.3) | |||
| Mean ALPg (std.err) | 156.45 (29.5) | 162.85 (40.0) | |||
| Mean ASTh (std.err) | 54.53 (8.4) | 56.30 (7.4) | |||
| Mean ALTi (std.err) | 34.79 (6.8) | 52.20 (7.0) | |||
| Mean bilirubin (std.err) | 1.99 (0.4) | 0.91 (0.2) | |||
| Mean albumin (std.err) | 3.42 (0.1) | 3.80 (0.1) | |||
| Mean INRj (std.err) | 1.26 (0.06) | 1.14 (0.05) | |||
| Mean creatinine (std.err) | 1.10 (0.1) | 1.18 (0.2) | |||
Small RNA-seq extraction and sequencing
Small RNA library preps were prepared using the QIAseq miRNA Library Kit (QIAGEN, Hilden, Germany). Adapters are first ligated sequentially to the 3′ and 5′ end of the miRNAs followed by cDNA synthesis with UMI assignment, cDNA cleanup, library amplification and final library cleanup. All protocol steps were followed based on the use of the miRNeasy Serum/Plasma kit used upstream for purification of RNA, which has been shown to be effective for saliva samples (Zahran et al., 2015). The recommended starting amount of total RNA is 5 µl of the RNA eluate when 200 µl of sample has been processed using the miRNAeasy Serum/Plasma Kit. Adapter dilutions throughout the protocol followed the serum/plasma recommendations. Cycles of library amplification followed that of a 10 ng input sample with 19 total cycles, consistent with manufacturer recommendations. Two RNA control samples (Human XpressRef RNA, QIAGEN, Hilden, Germany) with an input of 10 ng RNA were processed alongside the saliva samples. Final libraries were validated by Qubit Fluorometer (Invitrogen, Waltham, MA, USA) and Fragment Analyzer (Agilent Technologies, Inc, Santa Clara, CA, USA), and quantified via qPCR using NEBNext Library Quant Kit for Illumina (New England BioLabs, Inc, Ipswich, MA, USA). Pooled libraries were diluted, denatured and loaded onto the Illumina NextSeq 550 System, following the NextSeq User Guide. All 42 libraries were sequenced on one NextSeq High Output flow cell, single read 75 cycle run. FastQ files were developed for downstream analysis.
Data processing
FastQ files were first evaluated for read quality, using FastQC v0.11 (Andrews, 2010). Individual reads were then trimmed for phred quality scores (Q > 20) and presence of adapters, using fastp v0.19 software (Chen et al., 2018). Processed FastQ files were then aligned to the human genome (hg38) (Schneider et al., 2017) and annotated using known miRNA sequences from miRBase v22 (Griffiths-Jones, 2010). Alignments and miRNA counts were performed using the Rsubread package v2.2, following the authors’ guidelines for miRNA. Mature miRNA and miRNA hairpin precursors were both used for alignment, and are designated “hsa-miR” and “hsa-mir”, respectively. Data files, including miRNA counts are located in Files S1 and S2, and R code for the analysis described below can be found at: https://github.com/rotroff-lab/salivary-miRNA-HCC. Raw sequences can be found at: https://www.ncbi.nlm.nih.gov/bioproject/PRJNA755300.
Differential expression analysis
miRNA expression was compared between HCC and cirrhosis samples using the R package DESeq2 v1.28 (Love, Huber & Anders, 2014). First, raw read counts were normalized to account for sequencing depth, gene length, and RNA composition. Wald’s test was then performed on the normalized counts to identify any differentially expressed miRNA, using the cirrhosis samples as reference. All association tests included age, sex, race, body mass index and smoking status as model covariates to prevent confounding. In addition, patients were stratified to perform comparisons between those with CLD and the cirrhosis reference samples to distinguish miRNA associations specific to HCC vs those that may be due to impaired liver function. Log2 fold changes (logFC) were estimated using empirical Bayes procedure and implemented with the R package apeglm v1.10 (Zhu, Ibrahim & Love, 2019). All P values were false discovery rate (FDR) corrected (Benjamini & Hochberg, 1995). Any miRNA with an FDR P < 0.05 was considered significantly differentially expressed. The level of confidence for significant miRNAs were categorized based on read counts per million (CPM) into low, medium or high categories. miRNAs with <1 CPM in >20% of the samples were considered to be low confidence. miRNAs were classified as medium confidence if at least 20% of the samples had CPM ≥ 1 and high confidence if at least 20% of the samples had CPM ≥ 10. Only miRNAs meeting the criteria for medium or high confidence were considered for inclusion in the predictive models, as described below. Pathway analysis was performed using QIAGEN Ingenuity Pathway Analysis (IPA) software (Krämer et al., 2014). Here, differentially expressed miRNA (FDR P < 0.05) were mapped to mRNA and tested for overrepresentation in cancer and disease-specific pathways using the IPA knowledgebase. The analysis was performed (1) restricted to only cancer-related pathways and (2) cancer-related and disease-specific pathways combined.
Comparison to tissue-based miRNA profiles
Differentially abundant miRNAs were compared to microarray expression data from Martinez-Quetglas et al. (2016), GEO Accession Number: GSE74618 (Martinez-Quetglas et al., 2016). These data included miRNA expression data from 218 samples from human HCC tumors and 10 samples from cirrhotic non-tumoral tissue. Differential expression was conducted on the normalized expression values between HCC and cirrhosis samples, using the GEO2R tool available from the GEO database (Barrett et al., 2012). Overlapping miRNAs detected in both GSE74618 and the salivary miRNA data were compared and were adjusted using a FDR approach, as described above.
Predictive modeling for biomarker development
Model development was performed using the statistical software, R (Team, 2020). Significant miRNAs (FDR P < 0.05) were assessed for their ability to differentiate HCC and cirrhosis samples. Here, we used support vector machine (SVM) models with a radial basis function using the R caret package (Kuhn, 2008). Because some patients with HCC had no evidence of CLD, we also performed modeling on the subset of patients with CLD to compare with the cirrhosis group. Hyperparameters for both models with and without covariates are listed in Table S2. miRNA expression was mean centered and scaled by the standard deviation prior to modeling. Leave-one-out cross-validation was used to limit model over-fitting. Recursive feature selection with leave-one-out cross-validation was used to characterize feature importance and 10 miRNAs were selected for inclusion in the final models (Kuhn, 2008). Model performance was assessed based on the AUC, sensitivity, specificity, positive predictive value (PPV), negative predictive value (NPV), and balanced accuracy. PPV is the ratio of true positives out of all identified positives, whereas NPV is the ratio of true negatives out of all identified negatives.
Results
Differential expression of miRNAs in the saliva of HCC patients
A total of 4,565 miRNAs were detected and 365 miRNAs were significantly differentially expressed between HCC and cirrhosis samples and met the threshold for medium or high confidence (FDR P < 0.05), demonstrating a broad shift in miRNA profiles (Table S3).
The majority of the differentially expressed miRNAs (N = 283) were downregulated (logFC < 0) in the HCC samples compared to cirrhosis samples, and 50 of those had a logFC < −2 (Fig. 1A). The five most significantly differentially expressed miRNAs that also met the threshold for high confidence were: has-mir-3198-2 (logFC = −5.00, FDR P = 6.81 × 10⁻⁶), hsa-miR-3198 (logFC = −5.01, logFC = 6.80 × 10⁻⁶), hsa-mir-1246 (logFC = −6.03, FDR P = 7.98 × 10⁻⁶), hsa-miR-1246 (logFC = −6.86, FDR P = 7.98 × 10⁻⁶) and hsa-mir-3648-2 (logFC = −7.10, FDR P = 1.24 × 10⁻⁵). The 20 most significantly differentially expressed miRNA are shown in Table 2. A heatmap showing the expression of the significant miRNAs (FDR P < 0.05 and absolute |logFC| > 2) is shown in Fig. 2. Interestingly, a cluster of majority HCC patients was identified (N = 14 out of 16, 87.5%). The other four clusters had cirrhosis patients in majority. The number of cirrhosis patients in the four clusters was three (100%), three (75%), four (80%) and seven (58%), respectively. Notably, a cluster of three individuals from the cirrhosis group clustered together with elevated miRNA expression (Fig. 2). The Child-Pugh scores for these individuals were between five and seven, consistent with the rest of the control group, and no demographic or physical characteristics were identified that could explain the observed pattern (Fig. 2).

Figure 1: Volcano plots of differential salivary miRNA expression.
Volcano plots showing the unadjusted log2 fold change and log FDR P value for (A) salivary miRNAs in all patients with HCC (N = 20) compared to patients with cirrhosis only (N = 19), and (B) patients with HCC and chronic liver disease (N = 11) compared to patients with cirrhosis only (N = 19). Salivary miRNAs with a corresponding log fold change less than −5 and FDR P < 5 × 10⁻⁶ are annotated using color. Mature miRNA and hairpin precursors are referred as “miR” and “mir”, respectively.

Figure 2: Heatmap showing the expression of the significant miRNA in each sample (FDR P < 0.05 and absolute log2 fold change > 1).
Heatmap showing the expression of the significant miRNA in each sample (FDR P < 0.001 and absolute log2 fold change > 2). Clustering was performed using Ward’s D method and Manhattan distance. The dendrogram of samples (columns) was cut to create four clusters, where a distinct cluster with 14 out of 15 samples consisted of HCC samples was observed. The clustering appears to be largely driven by HCC status rather than the presence of chronic liver diseases, such as cirrhosis or fibrosis. The Barcelona Clinic Liver Cancer (BCLC) stage is shown in the annotation bar.
| miRNA | Log2 FC | Log2 FC SE | P value | FDR P value |
|---|---|---|---|---|
| hsa-miR-3198 | −5.01 | 1.50 | 5.96 × 10⁻⁹ | 6.81 × 10⁻⁶ |
| hsa-mir-3198-2 | −5.01 | 1.51 | 6.56 × 10⁻⁸ | 6.81 × 10⁻⁶ |
| hsa-miR-1246 | −6.86 | 1.46 | 1.18 × 10⁻⁸ | 7.98 × 10⁻⁶ |
| hsa-mir-1246 | −6.03 | 1.57 | 1.54 × 10⁻⁸ | 7.98 × 10⁻⁶ |
| hsa-mir-3648-2 | −7.10 | 1.94 | 3.59 × 10⁻⁸ | 1.24 × 10⁻⁵ |
| hsa-mir-766 | −5.05 | 1.79 | 3.50 × 10⁻⁸ | 1.24 × 10⁻⁵ |
| hsa-mir-1290 | −8.24 | 1.84 | 1.00 × 10⁻⁷ | 2.61 × 10⁻⁵ |
| hsa-miR-1290 | −8.24 | 1.84 | 1.00 × 10⁻⁷ | 2.61 × 10⁻⁵ |
| hsa-mir-3648-1 | −8.94 | 2.61 | 3.52 × 10⁻⁷ | 7.31 × 10⁻⁵ |
| hsa-miR-766-3p | −5.00 | 2.28 | 3.22 × 10⁻⁷ | 7.31 × 10⁻⁵ |
| hsa-mir-10401 | −9.85 | 3.36 | 7.48 × 10⁻⁷ | 1.29 × 10⁻⁴ |
| hsa-miR-191-3p | −2.67 | 1.15 | 7.47 × 10⁻⁷ | 1.29 × 10⁻⁴ |
| hsa-mir-133a-2 | −4.94 | 1.21 | 9.70 × 10⁻⁷ | 1.48 × 10⁻⁴ |
| hsa-miR-133a-3p | −5.11 | 1.28 | 9.96 × 10⁻⁷ | 1.48 × 10⁻⁴ |
| hsa-mir-3615 | −4.08 | 1.44 | 1.57 × 10⁻⁶ | 2.04 × 10⁻⁴ |
| hsa-miR-3615 | −4.08 | 1.44 | 1.57 × 10⁻⁶ | 2.04 × 10⁻⁴ |
| hsa-miR-454-5p | −2.53 | 0.94 | 1.70 × 10⁻⁶ | 2.08 × 10⁻⁴ |
| hsa-miR-4449 | −3.06 | 2.09 | 2.75 × 10⁻⁶ | 3.17 × 10⁻⁴ |
| hsa-miR-642a-3p | −0.61 | 1.13 | 3.25 × 10⁻⁶ | 3.38 × 10⁻⁴ |
| hsa-miR-642b-5p | −0.61 | 1.13 | 3.25 × 10⁻⁶ | 3.38 × 10⁻⁴ |
Pathway analysis revealed 96 (27%) differentially expressed miRNAs that were represented in at least one significant pathway in the IPA metabolic and signaling pathways knowledgebase (Table S4). Approximately a third of these miRNAs were associated with cancer-related diseases and pathways (N = 31 of 96) (Table S4). When the analysis was limited to cancer signaling pathways, the top three diseases were “early-stage invasive cervical squamous cell carcinoma” (miRNA N = 12, FDR P = 8.04 × 10⁻¹³), “hypopharyngeal squamous cell carcinoma” (miRNA N = 12, FDR P = 1.51 × 10⁻¹¹), and “early stage solid tumor” (miRNA N = 13, FDR P = 4.59 × 10⁻⁸). The cancer pathway with the greatest number of overlapping miRNAs differentially expressed in this cohort was “mammary tumor” (miRNA N = 35, FDR P = 2.26 × 10⁻²).
Comparison between patients with and without chronic liver disease (CLD)
Twelve out of 20 patient samples with HCC also had CLD, and these samples were compared with cirrhosis control samples. This resulted in 281 differentially expressed miRNAs, of which 248 (88%) were also significant in the analysis between all HCC samples and those with cirrhosis only (Table S5), suggesting that these differentially expressed miRNAs are likely to be due to the presence of HCC rather than the presence or lack of CLD. Out of 281 differentially expressed miRNA, 240 (85%) were downregulated (logFC < 0) in the HCC samples with CLD compared to only those with cirrhosis, and 49 of these had a logFC < −2 (Fig. 1B). The five most significantly differentially expressed miRNAs were: hsa-mir-122 (logFC = −6.65, FDR P = 7.54 × 10⁻⁵), hsa-mir-122b (logFC = −6.64, FDR P = 7.54 × 10⁻⁵), hsa-miR-122-5p (logFC = −6.64, FDR P = 7.54 × 10⁻⁵), hsa-mir-122b-3p (logFC = −6.64, FDR P = 7.54 × 10⁻⁵) and hsa-mir-603 (logFC = −4.86, FDR P = 1.14 × 10⁻⁴). These top five miRNAs were also considered to be of high confidence based on the CPM criterion. Pathway analysis after stratifying patients based on CLD status resulted in the same top rankings of cancer-related and disease-specific pathways (Table S6).
Comparison to tissue-based miRNA
Three significant miRNAs detected in saliva were also found to be differentially expressed in HCC tissue samples compared to cirrhotic liver tissue samples (FDR P < 0.05) (GSE74618) (Fig. 3 and Table S7). Forty-seven miRNAs were significantly different between HCC and cirrhosis tissue samples (FDR P < 0.05), 27 of which were evaluated in the saliva; whereas out of the 365 significant salivary miRNAs, 100 were also evaluated in tissue. However, only three miRNAs were significantly different in both cohorts (FDR P < 0.05) (Fig. 3). Out of the three significant miRNA found in each dataset, all were downregulated in saliva, but two were downregulated and one was upregulated in tissue (Fig. 3, Table 3). The miRNA comparisons are provided in Table S7. The significant miRNAs common to both datasets were hsa-mir-92b, hsa-mir-548i-2 and hsa-mir-548l.
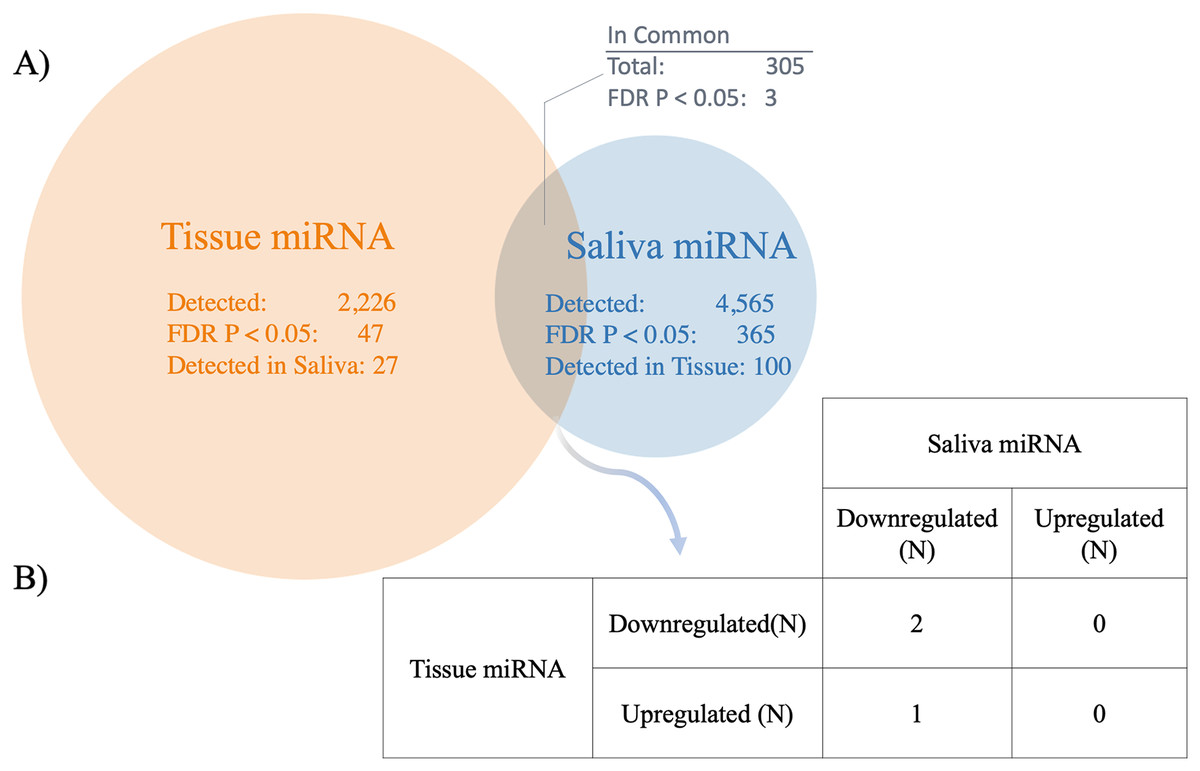
Figure 3: Comparison between salivary miRNAs and previously reported tissue-based miRNA expression.
(A) Venn diagram showing the overlap of miRNAs detected in tissue (25) compared to saliva in patients with hepatocellular carcinoma (HCC) vs cirrhosis. In addition, the overlap between miRNA determined to be statistically significantly different between patients with HCC and cirrhosis are shown (FDR P < 0.05). (B) The direction of association between saliva and tissue miRNA detected to be statistically significantly different between patients with HCC and cirrhosis across both biospecimens (FDR P < 0.05).
| Core miRNA | HCC vs cirrhosis liver tissuea | HCC vs cirrhosis saliva | |||
|---|---|---|---|---|---|
| miRNAb | logFC | FDR P value | logFC | FDR P value | |
| hsa-mir-1246 | hp_hsa-mir-1246_st | 0.051 | 7.73 × 10⁻¹ | −6.03 | 7.98 × 10⁻⁶ |
| hsa-mir-1246 | hsa-miR-1246_st | 0.677 | 6.24 × 10⁻¹ | −6.03 | 7.98 × 10⁻⁶ |
| hsa-mir-766 | hsa-miR-766_st | 0.026 | 9.53 × 10⁻¹ | −5.05 | 1.24 × 10⁻⁵ |
| hsa-mir-766 | hp_hsa-mir-766_st | −0.019 | 9.12 × 10⁻¹ | −5.05 | 1.24 × 10⁻⁵ |
| hsa-mir-1290 | hsa-miR-1290_st | 0.238 | 8.01 × 10⁻¹ | −8.24 | 2.61 × 10⁻⁵ |
| hsa-mir-133a-2 | hp_hsa-mir-133a-2_s_st | 0.029 | 8.53 × 10⁻¹ | −4.94 | 1.50 × 10⁻⁴ |
| hsa-mir-133a-2 | hp_hsa-mir-133a-2_st | −0.035 | 8.52 × 10⁻¹ | −4.94 | 1.50 × 10⁻⁴ |
| hsa-mir-133a-2 | hp_hsa-mir-133a-2_x_st | 0.010 | 9.85 × 10⁻¹ | −4.94 | 1.50 × 10⁻⁴ |
| hsa-mir-122 | hsa-miR-122-star_st | −0.351 | 6.22 × 10⁻¹ | −4.88 | 3.57 × 10⁻⁴ |
| hsa-mir-122 | hsa-miR-122_st | −0.149 | 7.94 × 10⁻¹ | −4.88 | 3.57 × 10⁻⁴ |
| hsa-mir-122 | hp_hsa-mir-122_st | −0.038 | 7.79 × 1−1 | −4.88 | 3.57 × 10⁻⁴ |
| hsa-mir-1180 | hsa-miR-1180_st | 0.809 | 8.5 × 10⁻² | −1.14 | 4.88 × 10⁻⁴ |
| hsa-mir-21 | hsa-miR-21_st | 1.790 | 6.97 × 10⁻⁵ | 0.06 | 8.79 × 10⁻¹ |
| hsa-mir-548i-2 | hp_hsa-mir-548i-2_st | −0.285 | 2.45 × 10⁻⁴ | −4.88 | 6.01 × 1−3 |
| hsa-mir-378c | hsa-miR-378c_st | −1.990 | 1.40 × 10⁻³ | 0.25 | 2.55 × 10⁻¹ |
| hsa-mir-125b-1 | hp_hsa-mir-125b-1_x_st | −0.286 | 2.05 × 10⁻³ | −1.08 | 8.13 × 10⁻² |
| hsa-mir-106b | hsa-miR-106b_st | 0.876 | 2.98 × 10⁻³ | −0.95 | 1.28 × 10⁻¹ |
| hsa-mir-548i-2 | hp_hsa-mir-548i-2_st | −0.285 | 2.45 × 10⁻⁴ | −4.88 | 6.01 × 10⁻³ |
| hsa-mir-548l | hp_hsa-mir-548l_x_st | −0.220 | 1.67 × 10⁻² | −0.37 | 9.31 × 10⁻³ |
| hsa-mir-92b | hsa-miR-92b-star_st | 1.170 | 3.72 × 10⁻² | −1.42 | 1.33 × 10⁻³ |
Notes:
Saliva miRNA predictive modeling
The predictive model trained on HCC +/− CLD vs cirrhosis optimized with the following 10 miRNAs: hsa-mir-576, hsa-miR-576-5p, hsa-mir-6727, hsa-mir-27b, hsa-miR-27b-3p, hsa-mir-4664, hsa-mir-125a, hsa-miR-6727-5p, hsa-mir-190b and hsa-miR-125a-5p. All of the above miRNAs met the threshold for high confidence except for hsa-mir-4664 and hsa-miR-6727-5p, which met the threshold for medium confidence. The model classified HCC with salivary miRNA alone (AUC = 0.74), and was improved with the inclusion of demographic and lifestyle variables (AUC = 0.87) (Fig. 4, Table 4). The model trained on the subset of patients with both HCC and CLD vs cirrhosis optimized with following miRNAs: hsa-miR-1262, hsa-mir-1262, hsa-mir-216a, hsa-mir-484, hsa-mir-30d, hsa-miR-216a-5p, hsa-miR-30d-5p, hsa-miR-484, hsa-mir-10401 and hsa-miR-454-3p. Five miRNAs above reached the threshold for high confidence: hsa-mir-30d, hsa-miR-30d-5p, hsa-miR-454-3p, hsa-mir-484 and hsa-miR-484. The model performed well, discriminating patients with HCC using salivary miRNA (AUC = 0.78) and with the inclusion of covariates (AUC = 0.87) (Fig. 4). Table 4 shows the AUC, sensitivity, specificity, and balanced accuracy for the predictive models, demonstrating that salivary miRNAs show potential for predicting which patients with CLD are likely to have HCC.

Figure 4: Development of a salivary miRNA signature to predict the presence of hepatocellular carcinoma.
(A) ROC curves of the support vector machine (SVM) models fit using the 10 miRNAs selected based on backward selection. (B) ROC curves of the model fit using the 10 selected miRNAs and covariates: age, sex, race, body mass index and smoking status. Gold curves show model performances for hepatocellular carcinoma (HCC) with or without chronic liver disease (CLD) cohort vs cirrhosis control samples. Blue curves show model performances for the HCC samples with CLD cohort vs cirrhosis control samples. Inclusion of covariates only improved the model performance when restricted to patients with CLD.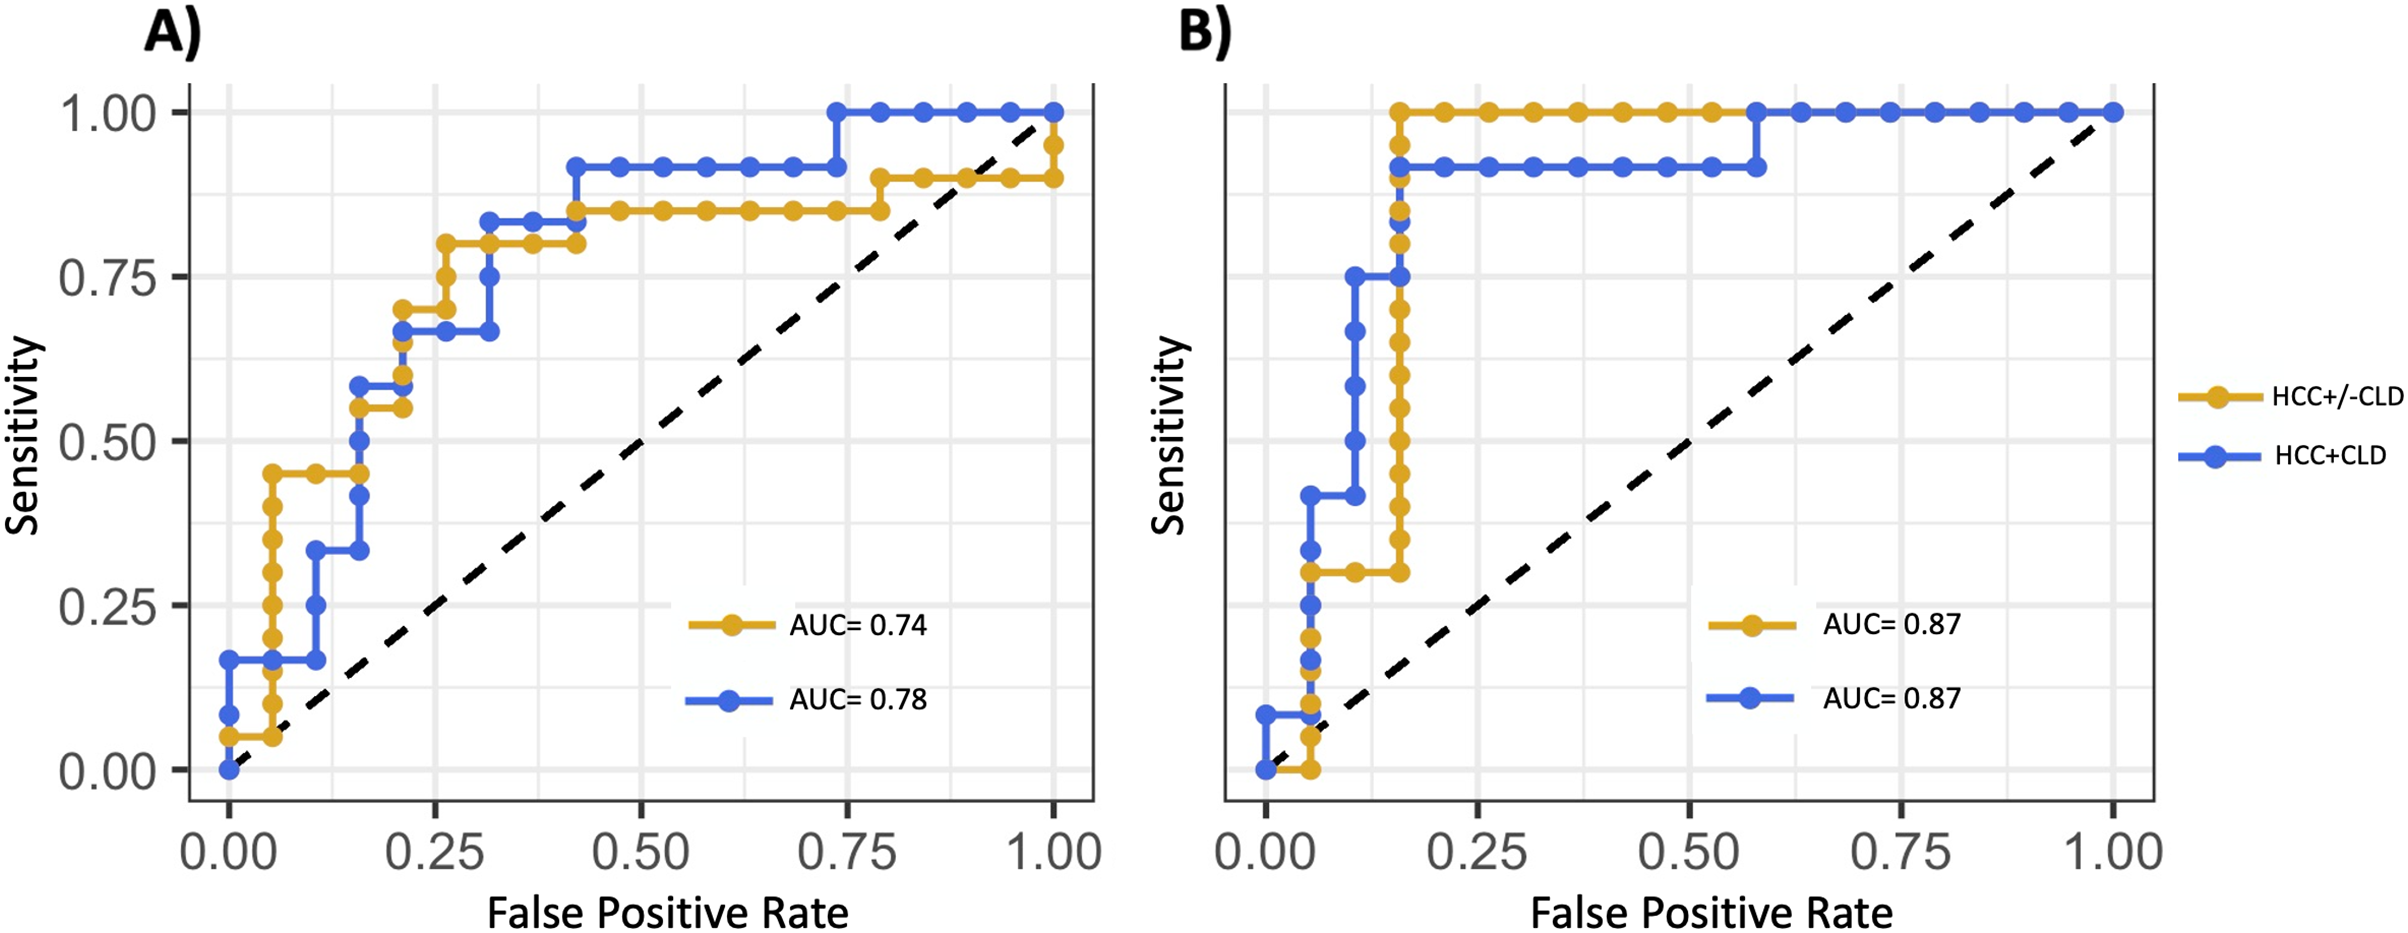
| Covariates included* | Sensitivity | Specificity | Balanced accuracy | PPV | NPV | AUC | |
|---|---|---|---|---|---|---|---|
| Model trained using data from all patients | |||||||
| miRNA: hsa-mir-576, hsa-miR-576-5p, hsa-mir-6727, hsa-mir-27b, hsa-miR-27b-3p, hsa-mir-4664, hsa-mir-125a, hsa-miR-6727-5p, hsa-mir-190b, hsa-miR-125a-5p | |||||||
| No | 0.80 | 0.74 | 0.77 | 0.75 | 0.74 | 0.74 | |
| Yes | 1.00 | 0.84 | 0.92 | 0.81 | 0.70 | 0.87 | |
| Model trained using data from patients with chronic liver disease | |||||||
| miRNA: hsa-miR-1262, hsa-mir-1262, hsa-mir-216a, hsa-mir-484, hsa-mir-30d, hsa-miR-216a-5p, hsa-miR-30d-5p, hsa-miR-484, hsa-mir-10401, hsa-miR-454-3p | |||||||
| No | 0.83 | 0.68 | 0.76 | 0.67 | 0.68 | 0.78 | |
| Yes | 0.92 | 0.84 | 0.88 | 0.82 | 0.85 | 0.87 | |
Notes:
PPV, positive predictive value; NPV, negative predictive value; AUC, Area under the receiver operating characteristic curve.
Discussion
Current approaches used to screen patients for HCC lack sensitivity, resulting in too many false negative diagnoses (Daniele et al., 2004; Ayuso et al., 2018). There is a significant need for improved screening tools for HCC that are also non-invasive and cost-effective. Making screening tools more widely accessible may result in detection of HCC prior to the onset of symptoms, which could improve patient outcomes (Singal, Pillai & Tiro, 2014). The relative stability of miRNA (Fabian, Sonenberg & Filipowicz, 2010), combined with the non-invasive nature of saliva collection, makes this an attractive option to address these needs. Liver cirrhosis is the primary risk factor for development of HCC, so distinguishing patients with HCC from this cohort of high-risk patients serves as a proof-of-principle for this potential screening approach (Fattovich et al., 2004).
Salivary miRNAs have demonstrated biomarker potential for CLD and cancers, such as oral cancer, lung cancer, and breast cancer (Zhang et al., 2010, 2012; Elashoff et al., 2012). However, to our knowledge this is the first study to investigate whether miRNAs expressed in saliva can distinguish individuals with HCC. miRNA are important cell signaling molecules affecting functions such as cell proliferation, apoptosis, metastasis, and many others (Jansson & Lund, 2012). Although, their importance and biomarker potential are recognized, relatively little is known about specific miRNA functions and targets (Gebert & MacRae, 2019).
Here, we observed that a large fraction of the miRNAs detected were differentially expressed in HCC patients vs cirrhosis (365 out of 4,565 detected miRNA), and the majority of these (78%, N = 283) were significantly down-regulated in patients with HCC vs cirrhosis (FDR P < 0.05). Importantly, in patients with both CLD and HCC, 248 miRNAs were significantly down-regulated compared to patients with cirrhosis without HCC—of which 85% were also statistically significantly down-regulated when all HCC patients were included (Tables S3, S5). This suggests that most of the miRNAs observed were dysregulated due to the presence of HCC regardless of the presence of CLD. This is further supported in Fig. 2, where the clustering of miRNAs is driven mostly by HCC status rather than the presence of CLD. Other studies have reported significant imbalances between the ratio of upregulated and downregulated salivary miRNAs in gastric cancer and pancreatic cancer (Machida et al., 2016; Li et al., 2018), and additional research is needed to determine the mechanism responsible for the downregulation of the miRNAs observed in this study. Furthermore, the patients with HCC were heterogeneous with regards to cancer stage, with 13/20 (65%) with very-early or early-stage HCC based on the Barcelona Clinic Liver Cancer (BCLC) stage of 0 or A. However, significant miRNAs clustered HCC samples together regardless of stage (Fig. 2) and the predictive model classified the majority of HCC samples correctly (Table 4) suggesting that the miRNA changes were detected even in early-stage HCC.
Pathway analysis established that salivary miRNAs differentially expressed in HCC are known to regulate genes involved in a range of cancer-related pathways, including those related to breast, and colorectal cancers (Ren et al., 2014; Zheng et al., 2019; Peng et al., 2020; Fuso et al., 2021; Ye et al., 2021). Furthermore, miRNAs were overrepresented for the “early stage solid tumor” pathway (FDR P = 4.59 × 10⁻⁸). Many of the salivary miRNAs detected in this study have been previously implicated in, or identified as potential biomarkers for, colorectal cancer, HCC, and other cancers. miR-122 has emerged as one of the most promising biomarkers for HCC and treatment response (Köberle et al., 2013; Amr et al., 2017). It is estimated that approximately 50% of HCC tumors exhibit downregulation of miR-122 compared to surrounding tissue (Kutay et al., 2006), and has also been shown to be reduced in the plasma of HCC patients (Amr et al., 2017). Here, we found that mir-122 (logFC = −4.88; FDR P = 3.57 × 10⁻⁴) and miR-122-5p (logFC = −4.86; FDR P = 3.57 × 10⁻⁴) were expressed with high confidence and significantly down-regulated in the saliva of HCC patients compared to those with cirrhosis. Interestingly, studies have shown that the hepatitis C virus (HCV) is dependent on miR-122 for replication, and that the subsequent sequestration of miR-122 by HCV has been linked to decreases in circulating miR-122 (Luna et al., 2015). Additional work will be needed to determine if the sequestration of miR-122 in patients with HCV is observed in saliva, and if that is driving the findings observed here. Zhou et al., 2016, previously reported that miR-98 was downregulated in HCC tissue compared to adjacent normal tissue, and displayed a negative correlation with tumor size, metastasis, and overall survival through modulation of SALL4. In saliva from patients with HCC, no detectable changes were observed for miR-98 expression. Other studies have also found discordance between salivary miRNA levels and their corresponding intra-tumor expression, although the mechanisms driving these differences are unknown (Fang et al., 2017; Li et al., 2018). miR-21 has been shown to be significantly upregulated in HCC tissue and commonly used cell lines, and targets PDCD4 and PTEN, resulting in increased cell proliferation (Meng et al., 2007; Frankel et al., 2008). Interestingly, although miR-21 has been detected in the saliva of colorectal cancer patients, prostate cancer patients, esophageal cancer patients, and head and neck cancer patients (Rapado-González et al., 2018), miR-21 was expressed with high confidence, but not significantly different between HCC and cirrhosis patients (logFC = 0.06; FDR P = 0.88) (Fig. S2).
The most significant differentially expressed salivary miRNAs were: hsa-mir-3198-2 (logFC = −5.00, FDR P = 6.81 × 10⁻⁶), hsa-miR-3198 (logFC = −5.01, logFC = 6.80 × 10⁻⁶), hsa-mir-1246 (logFC = −6.03, FDR P = 7.98 × 10⁻⁶), hsa-miR-1246 (logFC = −6.86, FDR P = 7.98 × 10⁻⁶) and hsa-mir-3648-2 (logFC = −7.10, FDR P = 1.24 × 10⁻⁵). These miRNA have been previously associated with HCC and other cancers (Du et al., 2009; Brunet Vega et al., 2013; Nagpal & Kulshreshtha, 2014; He et al., 2018; You et al., 2018; Nuoroozi et al., 2021). Expression of hsa-miR-3198 has been implicated in HCC recurrence (Itami-Matsumoto et al., 2019), epithelial ovarian cancer (Chong et al., 2015), metastatic colorectal cancer (Xiao et al., 2017) and inhibition of nasopharyngeal carcinoma proliferation (Yang et al., 2020). Additionally, upregulation of hsa-miR-1246 is linked with more aggressive HCC (Huang et al., 2020), metastasis of non-small-cell lung cancer (Kim et al., 2016, p. 12), and chemoresistance in oral carcinomas (Lin et al., 2018). Previously, the serum expression of miR-1246 has been proposed as a biomarker for both HCC and early tumor recurrence of HCC (Chuma et al., 2019; Chen et al., 2021). Expression of hsa-miR-191 in particular has been found to be associated 16 different cancers, including HCC (Nagpal & Kulshreshtha, 2014). Based on these findings, the following miRNAs, miR-122, miR-93, miR-125 and mir-1246 were significantly differentially expressed in patients with HCC, have prior associations with cancer, have putative mechanistic roles in HCC, and therefore present opportunities for future studies in HCC.
Several miRNAs demonstrated discriminatory ability between HCC and cirrhosis, although they were not always the most significantly differentially expressed miRNAs (Table 4). The best model was highly accurate in differentiating HCC and CLD (AUC = 0.87) (Fig. 4B). The addition of demographic and lifestyle variables substantially improved the accuracy of both models (Fig. 4). Although it is unknown whether this accuracy can be achieved in larger prospective cohorts, it does indicate that combinations of salivary miRNAs can successfully discriminate HCC and cirrhosis, warranting additional investigation.
As with any study, there are limitations that should be considered. The patients with HCC were all enrolled post-HCC diagnosis and it is not clear whether these miRNAs would have been detected earlier than with current clinical approaches. The biomarker potential was evaluated using SVM and leave-one-out cross-validation. However, the association results and the predictive model need to be validated in a larger, independent cohort, and ultimately in a prospective cohort, before salivary miRNAs can be considered clinically actionable. This exploratory pilot study utilized a real-world clinical cohort, and some patients have received previous treatments, and there were increases in certain conditions such as ascites, encephalopathy, and thyroid disorders in the cirrhosis cohort. However, these patient numbers were quite small and we were not powered to investigate their influence on miRNA expression. This analysis also included precursor hairpin miRNAs, which require additional processing to form mature miRNAs (Lee et al., 2008; Annese et al., 2020). Precursor miRNAs have been shown to be dysregulated in certain cancers (Thomson et al., 2006), although the mechanisms impacting these precursor miRNAs is not well understood. Furthermore, precursor miRNAs may be less stable and prone to degradation, making them poor biomarker candidates. However, studies have identified precursor miRNA configurations that are stable (Krol et al., 2004), indicating that additional research is needed to determine which precursor miRNAs may be stable in saliva and are potential biomarker candidates for HCC. However, because many of the salivary miRNAs detected here have been previously detected in the blood and tissue of patients with HCC, this lends additional support that many of the dysregulated salivary miRNAs observed here are indeed specific to the presence of HCC. The most significant miRNAs appear to cluster individuals based on HCC status rather than the presence of CLD or BCLC stage (Fig. 2), and the pathway analysis supports that most dysregulated miRNAs are enriched for cancer pathways. In addition, although we performed a stratified analysis comparing only patients with CLD, it is still possible that etiology of cirrhosis impacted miRNA expression. Additional studies with larger sample sizes will be needed to investigate the impact of cirrhosis etiology on miRNA expression and biomarker performance.
Conclusions
Overall, this study provides the first evidence that salivary miRNAs may serve as useful, non-invasive biomarkers for HCC. In addition, many of the identified miRNAs in saliva are concordant with previous findings of miRNAs in both plasma from HCC patients and HCC tissue. Future work should consider whether salivary miRNAs can help to improve detection of HCC either alone or in combination of other non-invasive biospecimens such as breath (Miller-Atkins et al., 2020), or in combination with other-omics technologies such as metabolomics or proteomics, to develop a more comprehensive and accurate screening approach for HCC.